20 Nov 2024

Financial situation analysis II.
Financial situation analysis II.
Asset structure examination (Current assets)
By briefly analyzing the following data, we can examine the structure of the current assets of the given company:
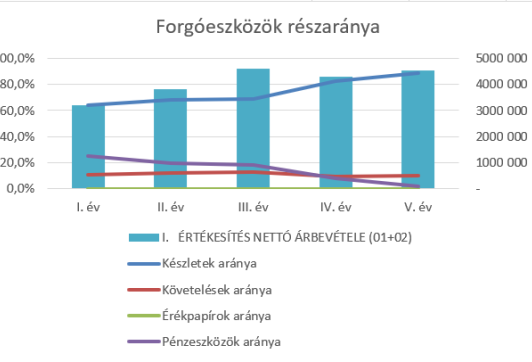
Analysis of financial situation - asset structure I. year II. year III year IV year V. year
Share of current assets 61.3% 58.4% 56.3% 59.8% 67.3%
Stock ratio 24.6% 55.7% 52.8% 34.3% 26.4%
Ratio of materials 76.1% 66.5% 81.0% 75.4% 69.3%
Share of goods 24.0% 33.5% 19.0% 24.6% 9.3%
Receivables ratio 25.3% 28.2% 38.7% 56.3% 58.4%
Ratio of securities 0.0% 0.0% 0.0% 0.0% 0.0%
Ratio of funds 49.8% 16.2% 8.7% 9.3% 15.2%
Source data: Own calculation

Diagram: Own editing
Based on the data, II. year, the proportion of stocks increased, i.e. a large stock accumulation took place. (This is also supported by the fact that - examining the entire balance sheet - the money in the bank account dwindled in parallel.) Then II. started to reduce its stocks after year. The company was only able to reduce its stock on a permanent, long-term basis, at the price of tying up its money to a greater extent in accounts receivable. In other words, he gave his customers a longer payment grace period. He tied up more money in claims.
If the payment delay is longer, more people will buy, so the stocks may decrease, and the sales turnover may increase proportionally, as well as the sales revenue. But the disadvantage of this is that customers pay later, which means a significant risk. Thus, its funds remained at a low level throughout the examined period, and as the inventory level swells, material handling and storage costs increase in direct proportion.
BUT! Risk reduction can also be behind the data, e.g. in order to avoid a subsequent purchase price increase, you can maintain a higher stock of materials. We can try to prevent the effects of inflation in advance by purchasing the materials cheaper. But this cannot be used in some industries, e.g.: in the food industry, this is not possible, because it is a question of perishable products.
Claims: it is an advantage that the income will increase, but we will get our money later, and the number of non-paying customers may increase and the proportion of doubtful non-paying customers may be higher, because we may also have customers who will not be interested in paying.
We can also find out from the data whether we are seeing the data of a manufacturing or service company. The first thing we need to check is whether there is a value stated on the finished products, because that means there is a final product. If there is a finished product and material, then this is a manufacturing company. If there are materials but no finished product, then he supplies. BUT! it may also be that there are no finished products because it immediately ships its products from production, i.e. it strictly adapts its production to customer orders.
Securities: 0% every year Dec. 31 in the period under review. BUT! E.g. discount treasury bill: we buy the discount at a price (below the face value) and pay it back at the face value, the difference between the two is the interest. It is not clear from the securities row whether there was a securities exchange during the year. If we want to check it, then we have to look at the values in the income of financial operations, because they have to be shown there.
